How Much Does the Average Gamer Spend? 2026 Data Breakdown
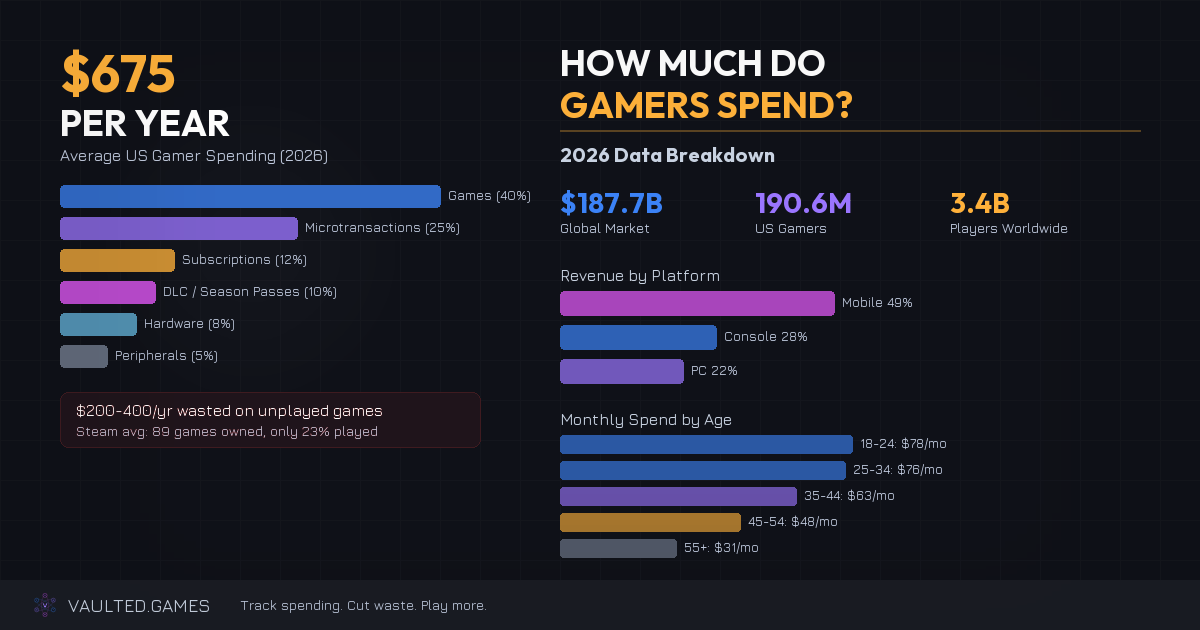
The average American gamer spends $56.28 per month on gaming. That's $675 per year going toward games, subscriptions, DLC, hardware, and all the little in-game purchases that add up faster than you think (Statista, 2024). And if you zoom out to the household level, ESA's 2024 report puts it even higher at $60.40/month.
But that number alone doesn't tell you much. What matters is where that money goes, how it compares across platforms and age groups, and how much of it is straight up wasted. So let's break it down.
The Big Picture: Gaming Is a $187 Billion Industry
Gaming isn't some niche hobby anymore. There are 3.4 billion gamers worldwide and 190.6 million of them are in the US alone. That's roughly 65% of all Americans playing games in some form (ESA, 2024).
The global gaming market hit $187.7 billion in 2025 and is projected to reach $213 billion by 2027. The US market alone accounts for $58.7 billion. For context, the US box office pulled in about $8.7 billion in 2024. Gaming is nearly 7x larger than movies in the US.
Where Your $675 Actually Goes
Here's the part most people never think about. That $675/year doesn't just go to buying games. It's spread across six major categories, and the split might surprise you.
| Category | Share of Spending | Annual Cost (Avg) |
|---|---|---|
| Full game purchases | 40% | $270 |
| In-game purchases / MTX | 25% | $169 |
| Subscriptions | 12% | $81 |
| DLC / Season passes | 10% | $67.50 |
| Hardware upgrades | 8% | $54 |
| Peripherals | 5% | $34 |
Full game purchases still eat the biggest slice at 40%, but in-game microtransactions are catching up fast at 25%. That's $169/year on skins, battle passes, loot boxes, and V-Bucks. You might not feel each $10 purchase, but they stack up to nearly $170 by year's end.
Subscriptions have carved out a solid 12% chunk at $81/year. And honestly, that number is only going up as more publishers push their own subscription models.
Spending by Platform: Mobile Dominates
When people think "gamer," they picture someone on a console or PC. But the revenue numbers paint a very different picture.
| Platform | Global Revenue (2025) | Market Share |
|---|---|---|
| Mobile | $92.6B | 49% |
| Console | $53.4B | 28% |
| PC | $41.7B | 22% |
Mobile gaming pulls in nearly half of all global gaming revenue. $92.6 billion. That includes everything from Candy Crush to Genshin Impact. Console gaming sits at $53.4 billion (28%) and PC at $41.7 billion (22%). The "casual" mobile market is quietly the biggest spender in the room.
Spending by Age Group: Who's Spending the Most?
If you're between 18 and 34, you're in the peak spending years. But the dropoff after 34 is real, likely because that's when mortgages, kids, and general life expenses start competing harder for those dollars.
| Age Group | Monthly Spend | Annual Spend |
|---|---|---|
| 18-24 | $78 | $936 |
| 25-34 | $76 | $912 |
| 35-44 | $63 | $756 |
| 45-54 | $48 | $576 |
| 55+ | $31 | $372 |
The 18-24 bracket edges out 25-34 by just $2/month, which makes sense. Fewer financial obligations, more disposable income going straight to gaming. But 25-34 year olds are right there, likely spending more on premium subscriptions and full-price launches while the younger group leans heavier on free-to-play and microtransactions.
The 35-44 bracket (that's my bracket, by the way) still clocks in at $63/month. That's $756/year on gaming. Not exactly pocket change, even if it feels like it when you're buying one game at a time.
The Backlog Problem: How Much Are You Wasting?
This is where it gets ugly. A massive portion of gaming spending goes toward games that never get played, barely get touched, or sit in a digital library collecting dust forever.
Steam backlogs are the most well-documented example. The average Steam user owns 89 games but only plays about 23% of them. That means roughly 68 games sitting there untouched. On console, the numbers are a bit murkier, but industry estimates put 40-60% of game purchases as never completed.
When you translate that into dollars, the average gamer is throwing away somewhere between $200 and $400 per year on games they don't play. That's not a guess, that's what happens when you combine impulse purchases, sale hoarding (looking at you, Steam Summer Sale), and the "I'll get to it eventually" mentality that never actually pans out.
And it's not just game purchases. Subscription waste is its own problem. Maybe you signed up for Game Pass to play one specific game, finished it in two weeks, and then forgot to cancel for three months. At $19.99/month, that's $40 down the drain on a service you weren't using.
The Subscription Layer
Subscriptions have become a significant part of gaming budgets. 58% of console gamers now have at least one gaming subscription, and the average is 1.7 services per gamer.
Here's what that costs annually for the most popular tiers:
| Service | Monthly Cost | Annual Cost |
|---|---|---|
| Game Pass Ultimate | $19.99 | $240 |
| PS Plus Extra | $14.99 | $180 |
| PS Plus Premium | $17.99 | $216 |
| Nintendo Switch Online + Expansion | $4.17 | $50 |
| EA Play | $5.99 | $72 |
If you're running Game Pass Ultimate and PS Plus Extra (not uncommon for multi-platform gamers), that's $420/year just on subscriptions before you buy a single game. Add EA Play and you're at $492. These services offer real value if you're actively using them, but a lot of gamers are paying for catalogs they barely touch.
Year-Over-Year Trends
Gaming spending isn't static. It moves with the economy, hardware cycles, and global events.
| Year | Trend | Notes |
|---|---|---|
| 2020 | +23% spike | COVID lockdowns drove massive spending increases |
| 2021 | Sustained highs | Hardware shortages limited console spend but software stayed strong |
| 2022-2023 | Normalization | 2-3% annual growth as pandemic effects faded |
| 2024 | +3.7% growth | Steady expansion, new console mid-cycle refreshes |
| 2025-2026 | +4-5% projected | GTA VI release expected to drive a spending surge |
The other major trend worth noting is the shift to digital. 72% of all game sales in 2024 were digital, up from about 50% just five years ago. Physical game sales aren't dead, but they're increasingly niche. This matters because digital purchases are easier to make impulsively (no driving to the store, no physical reminder of how many games you already own sitting on a shelf).
What Does All This Mean for Your Wallet?
Here's the reality. $675/year is the average, and averages hide a lot. If you're a multi-platform gamer with a couple of subscriptions who grabs games on sale "just in case," you could easily be north of $1,000/year. And if $200-$400 of that is going to waste on unplayed games, that's money you could've spent on, well, literally anything else.
The problem isn't that gaming is expensive. It's that most gamers have zero visibility into what they're actually spending. No running total. No "you bought 14 games this year and played 3 of them" dashboard. No alerts when a game on your wishlist drops in price so you can stop buying at full price on impulse.
That's exactly what we built Vaulted.Games to solve. Track your spending across platforms, see your backlog stats, set price alerts so you buy at the right time, and get a clear picture of where your gaming budget actually goes. You don't need to spend less on gaming. You just need to spend smarter.